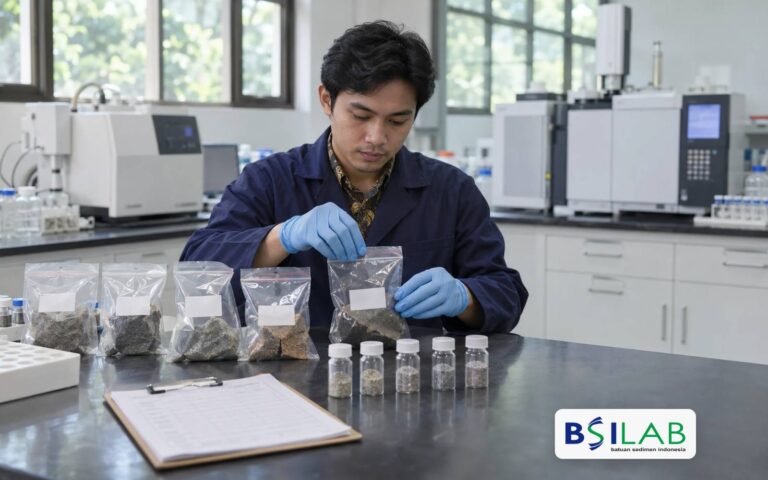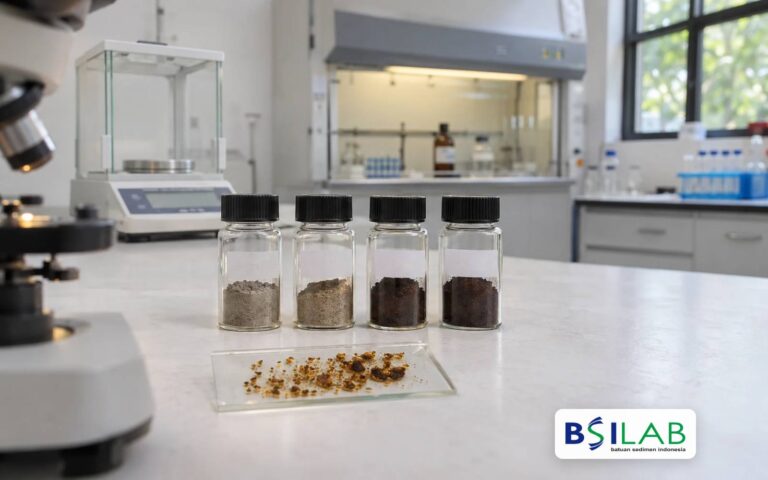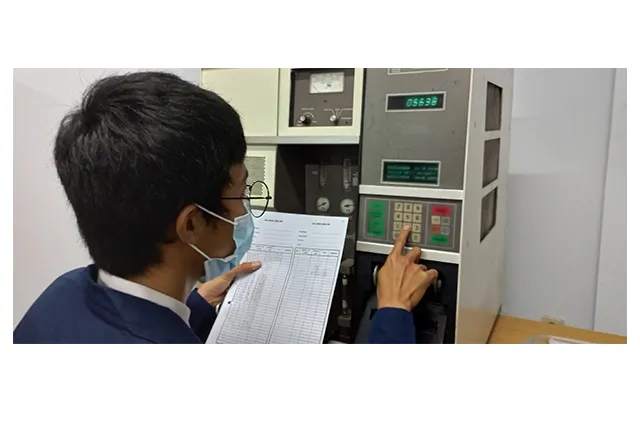
Rock-Eval Pyrolysis It's the standard method of the industry reading organic content in the rock: how much hydrocarbons are there, how much can still be produced, from what type of kerogen, and how mature. This method was developed by the Francois du Pétrole Institute in the late 1970-an and until now the backbone of the parent rock study. This article explains the meaning of every parameter—S1, S2, S3, Tmax, HI, OI, and PI—complete with examples of how to read it.
RockEval working principle
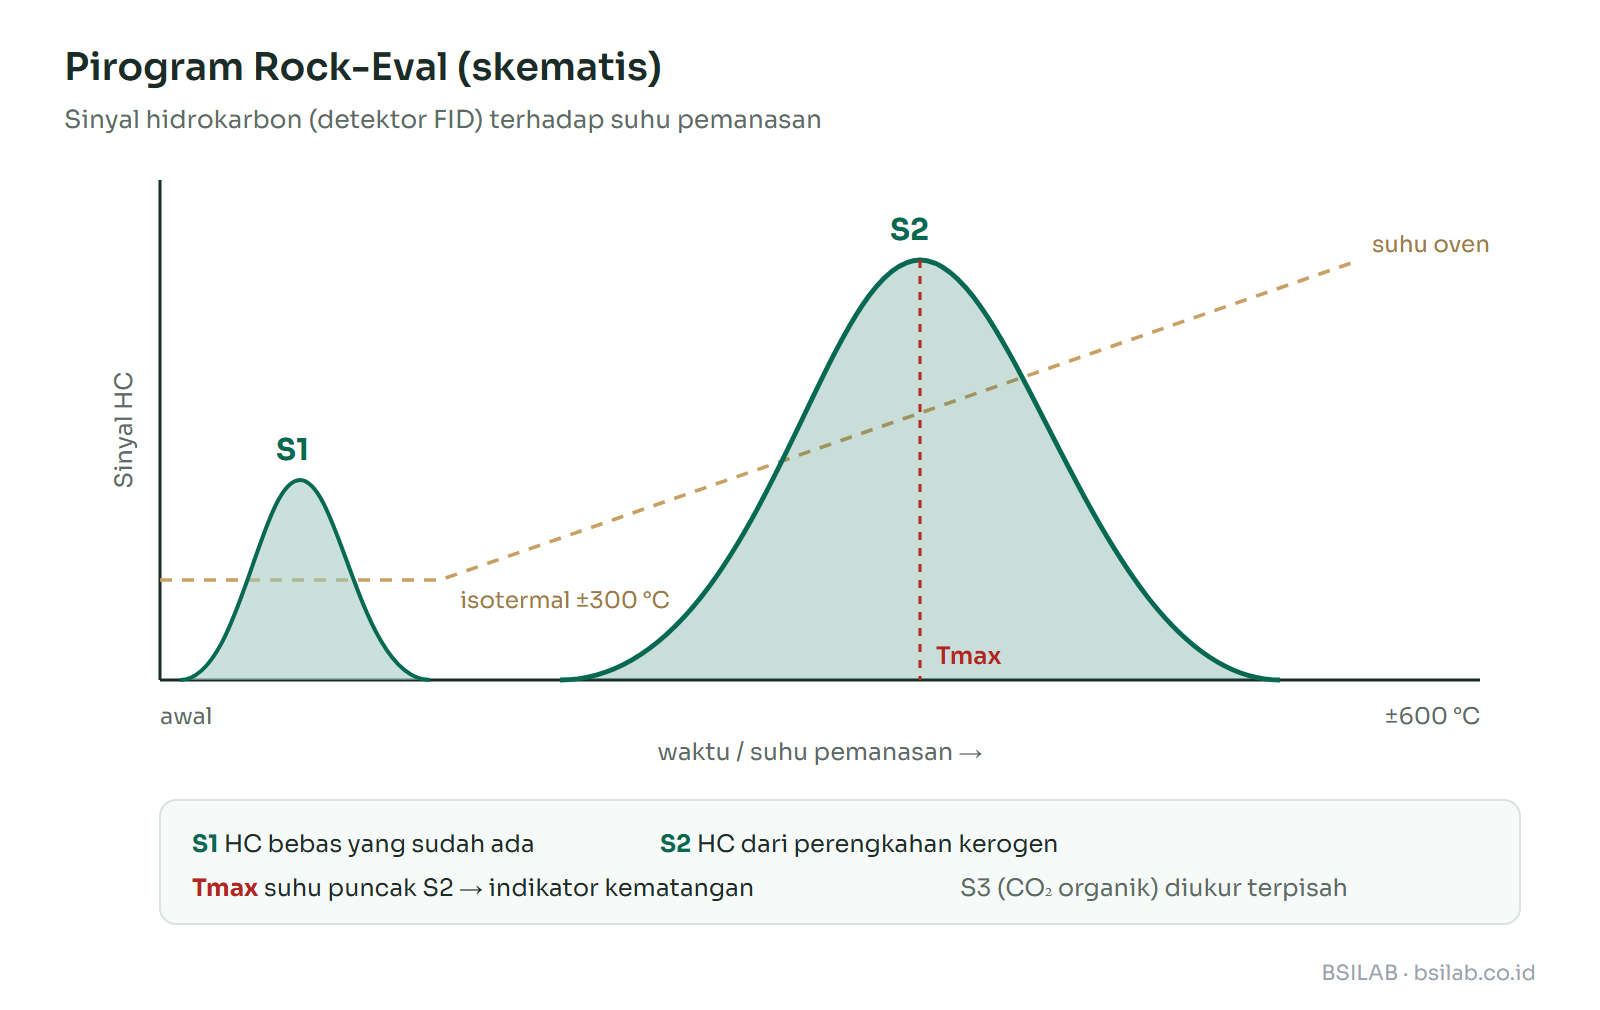
A small amount of smooth rock samples heated in an oxygen-free oven. The temperature starts to hold about 300 ° C so that hydrocarbons are freely evaporated. After that the temperature was increased gradually up to about 600 ° C, and the kerogens began to boil into hydrocarbons. The detector records the hydrocarbons that come out as two peaks, while the CO2 Measured apart.
Meaning each parameter
| Parameter | Rule / unit | How to do that. |
|---|---|---|
| S1 | mg HC / g rocks | Free hydrocarbons that are already formed and still stuck in the rocks. It gets bigger if there's oil-based mud contamination or oil migrating in. |
| S2 | mg HC / g rocks | Hydrocarbons generated from the kerogen grip during pyrolysis — potential imagery left The mother rocks. |
| S3 | mg CO2/ g rocks | CO2 organic material; high in oxygen-rich kerogen. |
| Tmax | ° C | Temperature at the height of S2 is reached. The more the rocks, the higher the Tmax. |
| HI | S2 × 100 / TOC (mg HC / g TOC) | Kerogen hydrogen's wealth is a marker of a type of kerogen. |
| OI | S3 × 100 / TOC (mg CO2/ g TOC) | Kerogen oxygen wealth. |
| IM | S1 / (S1 + S2) | An already formed proportion of hydrocarbon indicators of rigidity or presence of hydrocarbon migration. |
Interpretation reference table
Potential (S2) and kerogen type (HI)
| S2 (mg HC / g) | Potential | HI (mg HC / g TOC) | Kerogen type | |
|---|---|---|---|---|
| < 2,5 | Bad | > 600 | Type I — oil | |
| 2,5 – 5 | Medium | 300 – 600 | Type II — oil | |
| 5 – 10 | Good | 200 – 300 | Type II / III — oil & gas | |
| 10 – 20 | Very good | 50 – 200 | Type III — gas | |
| > 20 | Special | < 50 | IV Type — not potentially |
Adjustment (Tmax and PI)
| Stage | Tmax (° C) | IM |
|---|---|---|
| Uncooked | < 435 | < 0,10 |
| Start oil window | 435 – 445 | 0,10 – 0,15 |
| Top of the oil window | 445 – 450 | 0,25 – 0,40 |
| End of oil window | 450 – 470 | > 0,40 |
| Full pass (gas) | > 470 | — |
Read too: Kerogen Type I, II, III, and IV · Vitrinite Reflectance (% Ro): How to Read Wealth · Judging by Parent Stone (Rock Source)
The source of the threshold: Peters & Cassa (1994), AAPG Memoir 60.
Examples of reading results (illustration data)
Suppose a sample of shale gives the following results. These numbers are examples for exercise, not project data.
| TOC | S1 | S2 | S3 | Tmax |
|---|---|---|---|---|
| 2.5 wt% | 0,8 | 9,0 | 0,6 | 441 ° C |
- HI = 9,0 × 100 / 2,5 = 360 Amukerogen Type II, tends to produce oil.
- OI = 0,6 × 100 / 2,5 = 24 Poor hackerogen oxygen, consistent with Type II.
- IM = 0,8 / (0,8 + 9,0) = 0,08.
- Conclusion: TOC 2.5 wt% and S2 9.0 show parent rocks Good to the very good. Tmax 441 ° C puts it at the start of the oil window, while low PI indicates hydrocarbons are not yet formed. The next sensible step: confirmation of rigidity with vitrinite reflections and, if there's oil around it, correlation with GC-MS biomarker.
The two most common graphs used
- HI vs OI (pseudo diagram Van Kreveen) — Separating kerogen Type I, II, and III based on the content of hydrogen and oxygen.
- HI vs Tmax — featuring a type of kerogen at the same time as its maturity level, so it's easy to see whether low HI is caused by kerogen Type III or by a very mature type II kerogen.
Rock-Eval interpretation trap
- S2 is very small (generally < 0.2-0.g HC / g) makes Tmax not reliable because its peak is hard to determine.
- Bearing mud contamination Oil-based increases S1 and can shift the shape of the top S2.
- Hydrocarbon migration In the rock reservoir raises S1 and PI, so the sample looks more mature than it actually is.
- mineral matrix effect — The clay can withstand some of the hydrocarbons and lower the S2 on the sample with low TOC.
- Coal and stone flakes It has a slightly different level of Tmax and HI, so it needs special reference.
Need a Rocky-Eval analysis for parent rock study?
BSILAB provides TOC and Rock- Eval Pyrolysis as a screen package of parent rock.
Questions often asked
What's a Rock- Eval Pyrolysis?
Rock@@2 Organic (S3), and Tmax peak temperatures, of these parameters are known for potential, the type of kerogen, and the temperature of parent rock.
How do you calculate Hydrogen Index?
Hydrogen Index is calculated by HI = S2 × 100 / TOC, with S2 in mg HC per gram of rock and TOC in heavy percent. The results are specified in mg HC per gram TOC and used to determine the type of kerogen, for example HI 300-600 indicates type II kerogen.
What does Tmax 440 ° C mean?
Tmax around 440 ° C generally indicates the parent rocks are at the beginning of the oil formation window. The frequently used limit is under 435 ° C is not ripe, 435-470 ° C oil windows, and above 470 ° C gas phase. Interpretation should be confirmed with vitrinite reflection.
Why would HI be low on organic rock?
Low HI could mean the kerogen is indeed Type III that tends to produce gas, but it could also mean a very mature type II kerogen that most of its potential has been used. Plot HI against Tmax helps distinguish those two possibilities.
Espiralié, J., Laporte, J.L., Madec, M. dkk. Méthode rapide de caractérisation des roches mères, de leur potentiel pétrolier et de leur degré d'éáré. Revue de I 'Institute of François du Pétrole 32 (1). · Peters, K.E. & Cassa, M.R. (1994). Applied Source Rock Geochemistry. AAPG Memoir 60.